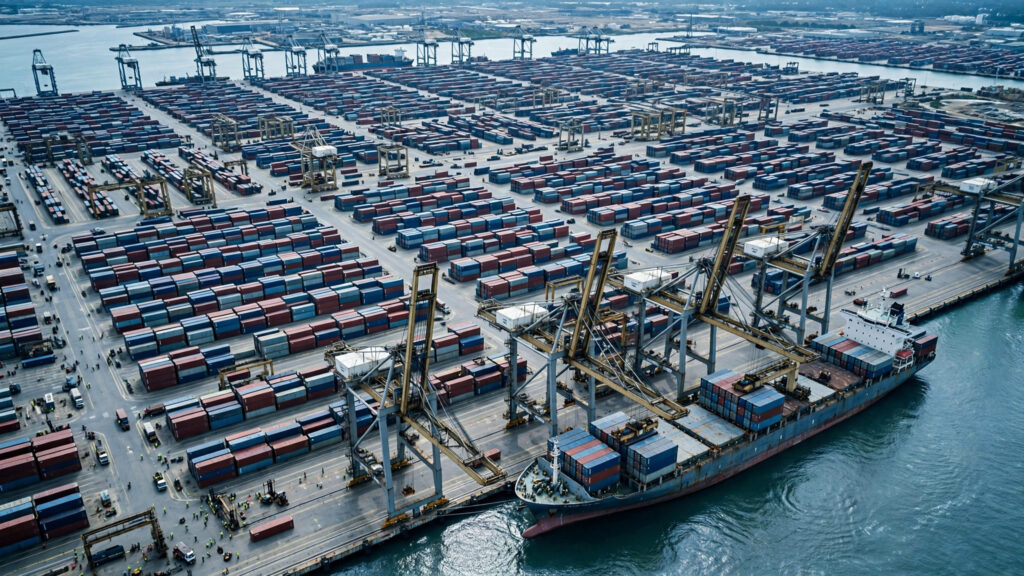
When prices surged in 2021 and 2022, Americans learned a new vocabulary: container rates, semiconductor shortages, port congestion, “just in time” versus “just in case.” The pandemic made visible what economists had long known — that the journey a product takes from factory to shelf is one of the most powerful forces shaping what you pay. In 2026, supply chains are functioning far better than during the crisis years, but they remain a central driver of US inflation through shipping costs, trade policy, and the ongoing reorganization of global production.
Table of Contents
- How Supply Chains Connect to the Prices You Pay
- The Pandemic’s Hard Lessons
- Shipping Costs: The Hidden Tax on Everything
- Tariffs, Reshoring, and the Great Reorganization
- The Supply Chain Inflation Picture in 2026
- What to Watch Next
- Key Takeaways
How Supply Chains Connect to the Prices You Pay
Every physical product you buy carries the cost of its supply chain in its price tag. Raw materials must be extracted, components manufactured (often in several countries), assembled, shipped across oceans, trucked to warehouses, and stocked on shelves. Each step adds costs: fuel, labor, warehousing, insurance, financing, and the profit margins of intermediaries. Economists estimate that logistics and transportation account for a meaningful share of the final price of many manufactured goods.
When any link in that chain becomes more expensive or breaks down, businesses face a choice: absorb the cost and accept lower margins, or pass it to consumers through higher prices. Research on the pandemic inflation surge found that supply chain disruptions accounted for a substantial portion of the price increases in goods — in some analyses, the majority of the spike in goods inflation. Services inflation, driven more by wages, followed a different path, which is why economists now track goods and services inflation separately.
This transmission works in reverse, too. When shipping rates collapse and bottlenecks clear, goods prices can fall even while the broader economy grows — a disinflationary gift. Understanding this two-way street is essential for reading inflation data correctly, as our guide to core versus headline inflation explains in more detail.
The Pandemic’s Hard Lessons
The 2020-2022 period was a masterclass in supply chain fragility. Factories shut down just as stimulus-fueled consumers shifted spending from services to goods, creating a demand surge that collided with constrained supply. Container shipping rates from Asia to the US West Coast rose roughly tenfold at the peak. A shortage of semiconductors idled auto plants worldwide, sending used-car prices soaring by tens of percent. Ports from Los Angeles to Savannah stacked up with waiting vessels.
Businesses responded by over-ordering — the “bullwhip effect” — which amplified shortages and then left companies with excess inventory when demand normalized. The Federal Reserve initially characterized inflation as “transitory,” expecting supply chains to heal quickly; they eventually did, but far more slowly than hoped, and the episode reshaped how both businesses and policymakers think about resilience.
The strategic lesson was the danger of hyper-efficient, single-source supply chains. “Just in time” manufacturing — keeping minimal inventory and relying on precisely timed deliveries — minimizes costs in calm times but has no buffer when shocks hit. Since then, many firms have shifted toward “just in case” strategies: larger inventories, multiple suppliers, and production spread across regions. That resilience comes at a cost, and part of today’s price level reflects businesses paying an insurance premium against the next disruption. For more on how firms adapt, see how oil prices ripple through the US economy, since energy is the master input to every supply chain.
Shipping Costs: The Hidden Tax on Everything
Ocean freight is the circulatory system of global trade, carrying the vast majority of goods by volume. When container rates spike — as they periodically do from Red Sea disruptions, Panama Canal drought restrictions, or port labor disputes — the cost lands on importers within weeks and on consumers within months. Research suggests the pass-through from shipping costs to consumer prices is real but partial and delayed, typically unfolding over several quarters.
Domestic freight matters just as much. Trucking moves the overwhelming majority of US freight by value, and diesel prices, driver availability, and warehouse capacity all feed into final prices. The American Trucking Associations’ data on tonnage and the BLS producer price indexes for freight are among the indicators economists use to gauge pipeline pressures before they reach store shelves.
In 2026, global shipping has largely normalized from crisis peaks, but the system runs hotter and more expensively than the pre-pandemic baseline. Insurers charge more for routes through risky waters, carriers have consolidated pricing power, and new environmental regulations on maritime fuel add structural costs. The era of ever-cheaper freight that quietly suppressed goods prices for two decades appears to be over.
Tariffs, Reshoring, and the Great Reorganization
Trade policy has become a first-order supply chain issue. Tariffs function as a tax on imported inputs and finished goods, and the evidence from recent rounds is that much of the cost is borne by domestic importers and ultimately consumers rather than foreign exporters. When tariffs rise on steel, electronics components, or consumer goods, the price effects ripple through every product that uses those inputs.
Parallel to tariffs runs the reshoring and “friend-shoring” movement — relocating production from China to the US, Mexico, Vietnam, India, and allied nations. The CHIPS Act and clean-energy incentives have accelerated domestic semiconductor and battery investment. Diversification improves resilience, but building new factories, training workers, and replicating supplier ecosystems takes years and costs more than the optimized China-centered model it replaces. Economists describe this as trading efficiency for security — a rational choice with an inflationary tilt.
Mexico’s rise as a top US trading partner illustrates the reorganization in action, as does Vietnam’s manufacturing boom. These shifts do not happen overnight: a factory that took a decade to optimize in Shenzhen cannot be cloned in Monterrey in a year. During the transition, friction costs — expedited shipping, duplicate tooling, quality problems — add up. The Census Bureau’s trade data tracks this rewiring in near real time.
The Supply Chain Inflation Picture in 2026
As of 2026, the acute supply-driven inflation of the pandemic years has faded, but supply chains exert a steady background pressure on prices. Goods inflation has cooled dramatically from its peaks yet settles above the near-zero rates of the 2010s, reflecting structurally higher logistics costs, tariff effects, and resilience investments. Services inflation, driven by wages and housing, is now the stickier problem — but goods can reaccelerate quickly if a new disruption hits.
Several pressure points bear watching. Geopolitical tensions can close shipping lanes with little warning. Extreme weather — droughts affecting the Panama Canal, hurricanes hitting Gulf ports and refineries — is striking infrastructure more often. And the technology transition itself creates bottlenecks: surging demand for electrical components, transformers, and data-center equipment strains specialized supply chains even in a calm macro environment.
The Federal Reserve watches these dynamics closely because supply-driven inflation poses the classic policy dilemma: raising rates does not unclog a port or build a chip fab. Officials must judge how much of current inflation is supply-related (best left to heal on its own) versus demand-related (where tighter policy helps). Misreading that mix in either direction carries real costs, a tension explored further in our analysis of the federal funds rate.
What to Watch Next
For readers tracking this story, a few indicators are worth following. The New York Fed’s Global Supply Chain Pressure Index distills shipping costs, delivery times, and backlogs into a single gauge. Container rate benchmarks show real-time freight pricing. And the ISM manufacturing survey’s supplier-deliveries and prices-paid components offer an early read on pipeline pressures each month.
Businesses, meanwhile, continue investing in visibility — software that maps multi-tier supplier networks — and in redundancy. The Small Business Administration offers resources for smaller firms navigating supplier diversification, since supply chain shocks hit small businesses hardest: they lack the purchasing power to secure scarce inputs and the margins to absorb cost spikes.
The long-run question is whether the world settles into a new equilibrium of regionalized, resilient, somewhat costlier supply chains — or whether competitive pressures eventually drive another wave of hyper-efficiency. History suggests the pendulum swings; the task for 2026 is managing where it currently rests.